delabj
Joshua L.
de la Bruere
Joshua L. de la Bruere
Joshua@delabj.com | @delaBJL | (563) 484-0036
Portfolio | Joshua de la Bruere


ggCyberpunk

Avatar

ggCyberpunk

A package that makes it easy to create a cyberpunk themed plot with ggplot2. Comes with geoms and a theme as well as color palettes.


Read More


VIZ: Tidy Tuesday

Avatar

VIZ: Tidy Tuesday

TidyTuesday is a social coding exersise that uses R and the Tidyverse to work with a new data set each week, creating a model or visualization. This is my github Repo where I post my code and my plots.
 

See Viz


SENIOR PROJECT: CSES ANALYSIS

Avatar

SENIOR PROJECT: CSES ANALYSIS

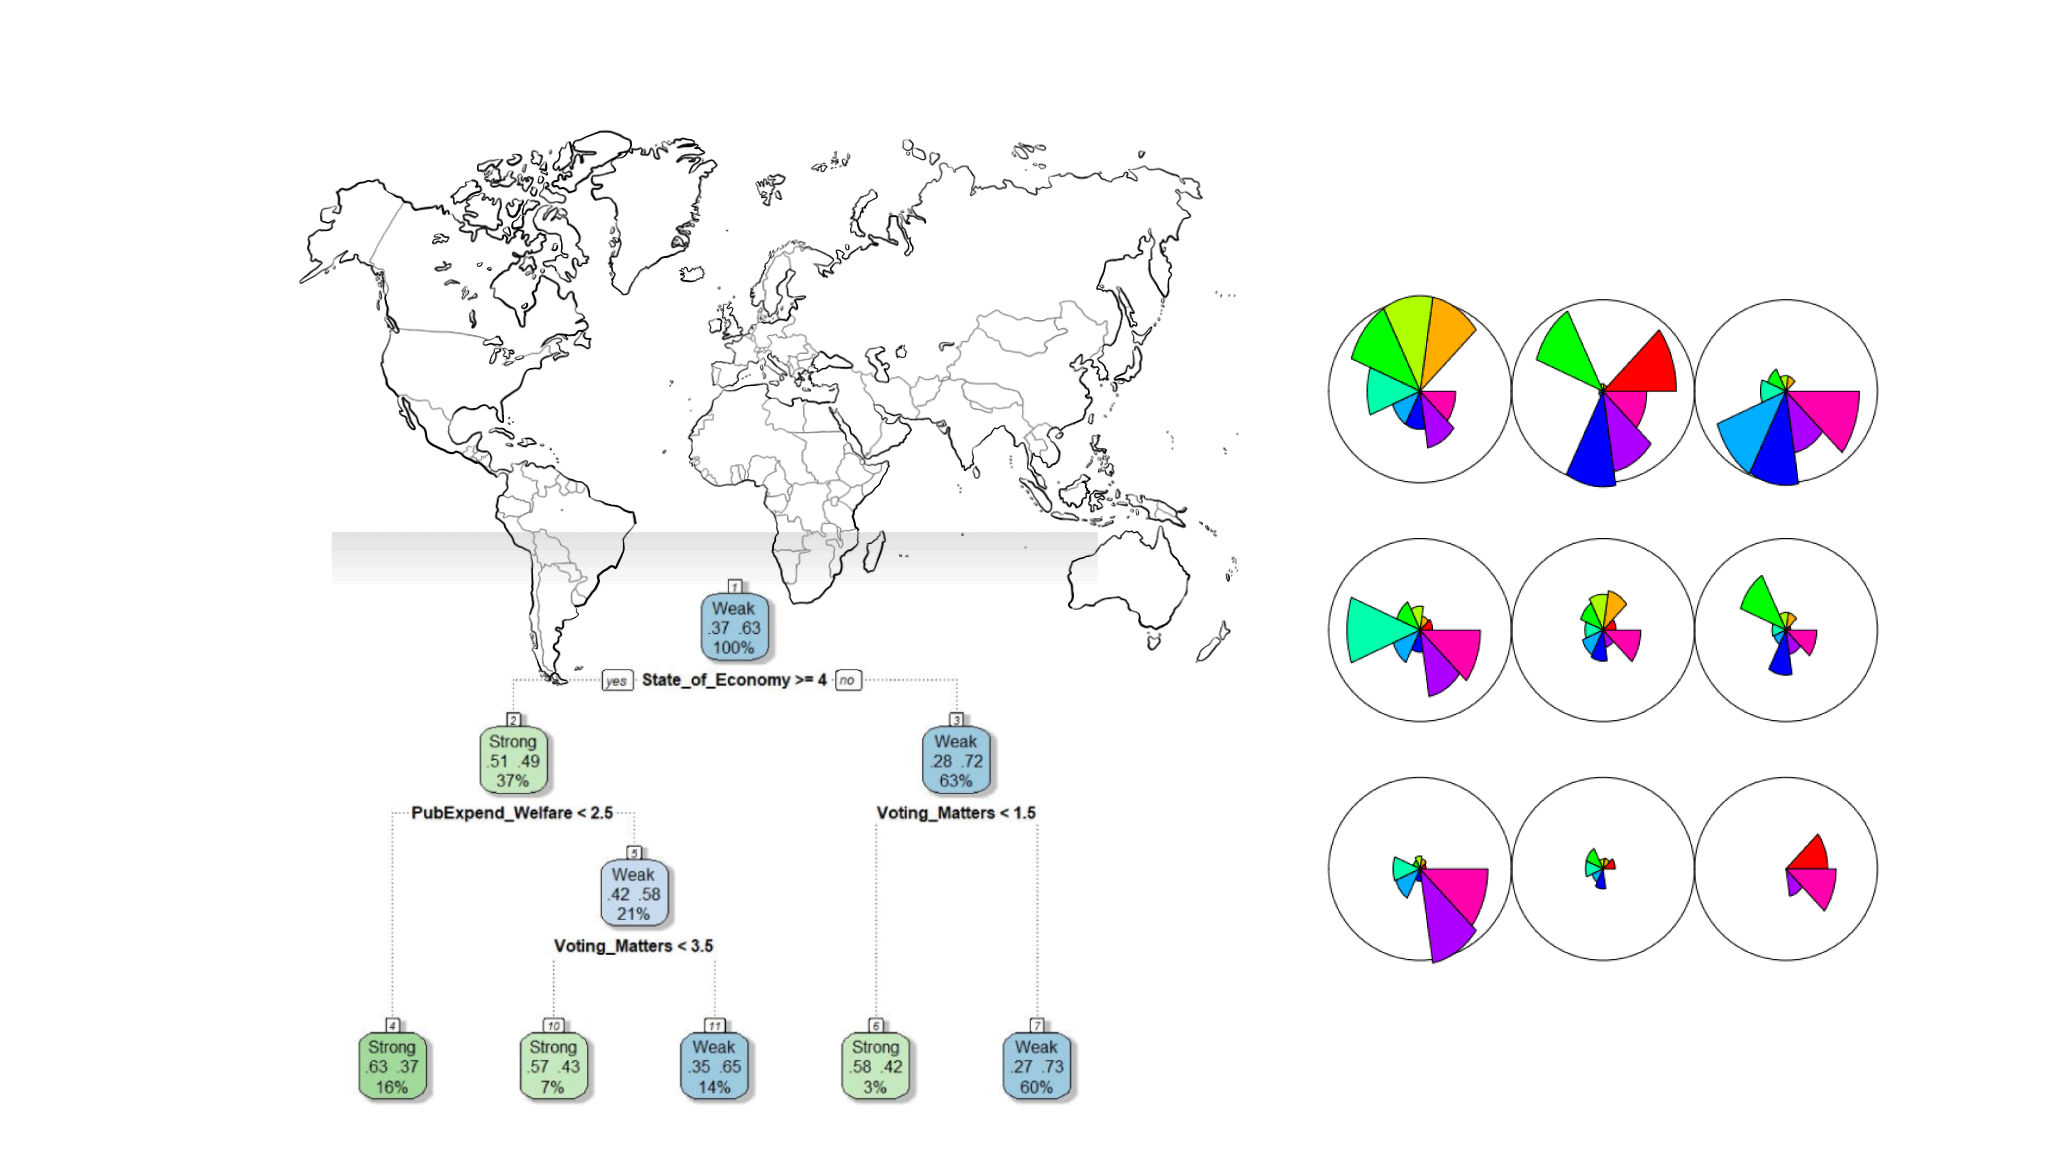
For my senior capstone, I used data provided by the CSES about elections around the world. Using the module 4 data, I used machine learning and statistical techniques to learn about satistifaction with democracy including Kohonen Networks, logistic regression, decision trees, and random forests.


Read More


VIz: UFO SIGHTINGS IN US

Avatar

VIz: UFO SIGHTINGS IN US

In my month of Visulaization, I examined and cleaned a data set from Kaggle about UFO sightings. I cleaned and transformed the data and created an animated gif using gganimate. Doing this I noticed an interesting trend with a spike in sitings


See Viz Code


Bot: Emoji Iowa

Avatar

Bot: Emoji Iowa

Using Google Apps Script, openweather maps API, and the Twitter API I made a twitter bot that tweets once every 6 hours to create a weather map of Iowa expressed with emoji. This was inspired by another twitter account of @EmojiWeatherCA.


See Bot Code


Lights Out

Avatar

Lights Out

Lights Out is a puzzle-game relased in 1995 as a hand held device. Pressing lights will toggle the lights Use of linear algebra can model the moves and search for a solution When learning a programming language, I often recreate this game I have written a blog post about the math and have a javascript version for demo.


Read More Play


PREDICTING OPS

Avatar

PREDICTING OPS

On Base Percentage is a useful baseball statitsitic to determine the value of a player at bat. Using linear regression and ANOVA I examine how to predict this stat. Initially done in 2017, and revisitied in 2018.


2018 2017


VIS: THE BIG GAME

Avatar

VIS: THE BIG GAME

Using data from Kaggle, I decided to plot the win/loss ratios of each paiting of teams in the Big Game This inteactive plot was created in R with ggplot2 and plotly and was my first forray into interactive plots.


See Viz Code


Baseball Player Classification

Avatar

Baseball Player Classification

Using R, I and a teammate used various classification techniques to predict if a player was an infielder or outfielder based on at-bat stats. Techniques used Classification Trees, Random Forests, and K-means klustering.


Read More


Contact & Social Media


Email: Joshua@delabj.com
Twitter: @delabjl
Instagram: Thedelabj
 

© 2019 Joshua L. de la Bruere

Contact & Social Media

Email: Joshua@delabj.com
Twitter: @delabjl
Instagram: Thedelabj
Quick Links


Home

Prortfolio

© 2019 Joshua L. de la Bruere

Contact & Social Media


Email: Joshua@delabj.com
Twitter: @delabjl
Instagram: Thedelabj
 

© 2019 Joshua L. de la Bruere

Contact & Social Media

Email: Joshua@delabj.com
Twitter: @delabjl
Instagram: Thedelabj
Quick Links


Home

Prortfolio

© 2019 Joshua L. de la Bruere